Sinus Tachycardia (ST) — ECG Rhythm | Telemetric Pro
A sinus rhythm with a rate above 100 bpm. The SA node fires faster than normal — usually because the body is asking it to — but conduction follows the same pathway as NSR.
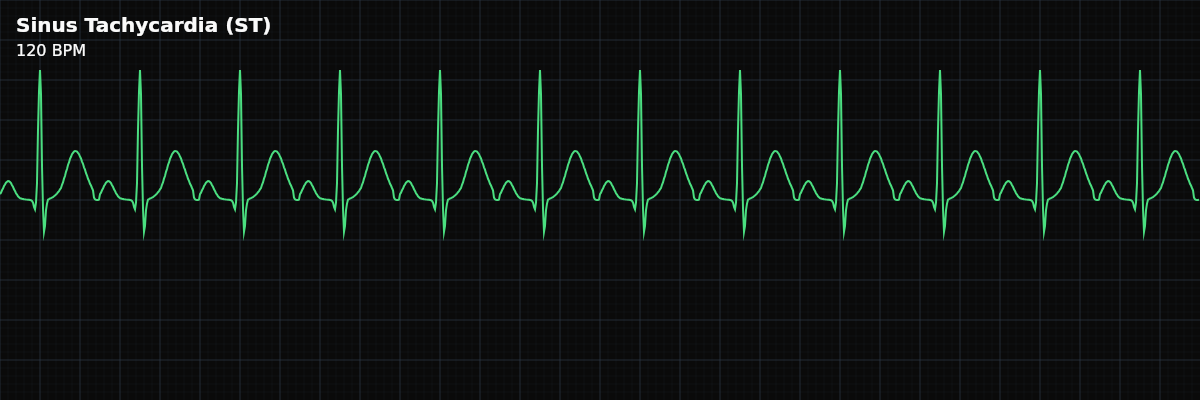
| Rate | > 100 bpm |
|---|---|
| Rhythm | Regular |
| P Waves | Upright, one before each QRS |
| PR Interval | 0.12–0.20 s |
| QRS Duration | < 0.12 s |
Why This Rhythm Matters
Sinus Tachycardia is the mirror image of Sinus Bradycardia — another single-criterion deviation from NSR. The conduction pathway is unchanged; only the speed increased. But unlike bradycardia, a fast sinus rate introduces a practical challenge: as the rate climbs, the waveforms start to crowd together and P waves can become difficult to see. Learning to recognize sinus tachycardia — and to distinguish it from other fast rhythms — is one of the most common tasks you'll face at the monitor.
What Changed: The SA Node Sped Up
Increased sympathetic drive — from exercise, pain, fever, anxiety, or other demands — pushes the SA node above its normal 60–100 bpm range. The impulse still originates in the SA node and still travels the normal conduction pathway. The tracing looks like NSR with the complexes pushed closer together.
The Five Criteria: ST vs. NSR
Same checklist, one change — the rate crossed above 100 bpm.
- Rate: Greater than 100 bpm
- RR interval less than 600 ms (15 mm / 3 large boxes). Typically 100–150 bpm at rest; may reach 160–180 under severe physiological stress.
- Regularity: Regular
- RR intervals are equal throughout. Rate changes are gradual — not sudden on/off.
- P waves: Upright, uniform, one before every QRS
- Identical to NSR at moderate rates. At rates above ~140 bpm, P waves may merge with the preceding T wave and become harder to see.
- PR interval: 120–200 ms, constant
- Unchanged from NSR. May shorten slightly at very fast rates but remains within normal limits.
- QRS complex: Narrow (< 120 ms), one after every P wave
- Unchanged from NSR. His-Purkinje conduction is intact.
Rate
The defining feature: a heart rate above 100 bpm, meaning the RR interval is less than 600 ms (3 large boxes). The faster the rate, the closer the complexes sit to each other.
**Rate-to-interval reference:** - **100 bpm** → RR = 600 ms (3 large boxes) — the boundary - **120 bpm** → RR = 500 ms (2.5 large boxes) - **150 bpm** → RR = 400 ms (2 large boxes) - **180 bpm** → RR = 333 ms (1.7 large boxes)
Regularity
Sinus Tachycardia is regular — equal RR intervals throughout. But there's an important behavioral feature: the rate changes *gradually*. When the underlying stimulus builds (rising fever, worsening pain), the rate climbs progressively. When the stimulus resolves, it comes back down progressively. There is no sudden "switch on" or "switch off." This gradual onset and offset is a key distinction from other fast rhythms.
P Waves at High Rates
At moderate rates (100–130 bpm), P waves are clearly visible — upright, uniform, and easy to identify just as in NSR. The challenge begins above ~140 bpm. As the rate increases, the T wave of one beat and the P wave of the next beat start to overlap. The P wave gets "buried" in the preceding T wave.
At rates approaching 180 bpm, P waves can become completely buried within the T wave — virtually invisible. Look for subtle changes in T wave morphology: increased height, a notch, or asymmetry compared to what you'd expect. These clues suggest a P wave is hiding inside the T.
PR Interval & QRS Complex
Both are unchanged from NSR. The PR interval remains 120–200 ms and constant (it may shorten slightly at very fast rates but stays within normal limits). The QRS stays narrow (< 120 ms). These confirm that conduction through the AV node and His-Purkinje system is normal — the only thing moving faster is the SA node.
QT Interval
As heart rate increases, the QT interval naturally shortens — the ventricles need less time to repolarize when cycles are closer together. This is a normal adaptation, not a sign of pathology. At 100 bpm the QT may be around 360 ms; at 150 bpm it shortens to approximately 280 ms.
The Key Distinction: Sinus Tachycardia vs. SVT
At rates above 150 bpm, Sinus Tachycardia can look similar to other supraventricular tachycardias (SVT) because the P waves may be hidden. As a monitor tech, knowing the differences helps you communicate accurately to the clinical team.